5 Interpreting Graphs
Learning Objectives
Lesson Activity
|
Lesson SlideshowSlideshow by Mr Perry
|
Lesson Notes - Ready to print
| 1.1.1.05_interpreting_graphs.pdf |
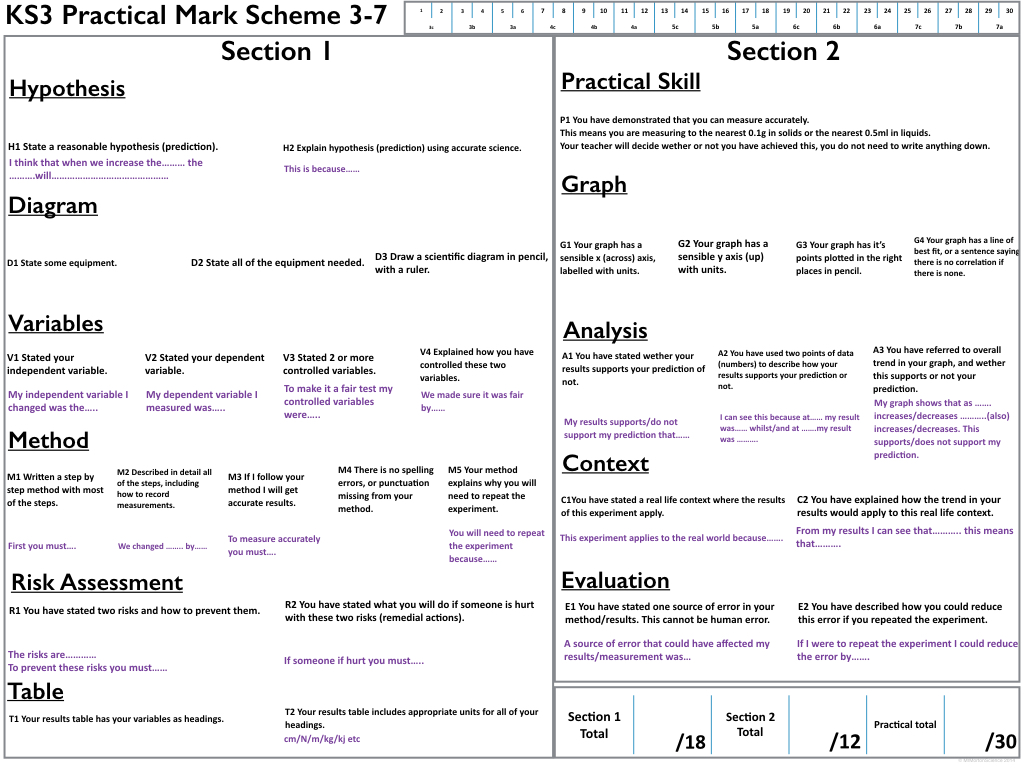
| practical_markschemes_qis.002.jpeg |
Home Study Task(s) -Using this guide produce a line graph using excel for the data from your experiment. If you do not have data from your experiment use the data below:
|
Lesson filesIOS Download (keynote presentation)
Windows Download (powerpoint presentation) Youtube video of the Day...Different ways to describe trends in graphs, improve your vocabulary!
| ||
Want to leave a comment ? Here are some things that I would like to read in the message board for this lesson (link below)
Mr Morton
- Questions about the lesson
- Faulty/broken links
- Wrong/missing content
- Suggestions for improvements
Mr Morton
